The SA Reserve Bank released its monthly business cycle indicators today (24 July 2012). Unfortunately it paints a bleak picture of future prospects, with seven of the eleven component time series that were available for May, showing a deterioration. One series remained unchanged and three improved. According to the Bank, the largest negative contributions in May came from a deterioration in the BER's Business Confidence Index, as well as a decline in the export commodity price index. The major positive contributions to the movement in the leading indicator in May came from an improvement in the number of residential building plans passed, followed by an acceleration in the twelve-month percentage change in the number of new passenger vehicles sold.


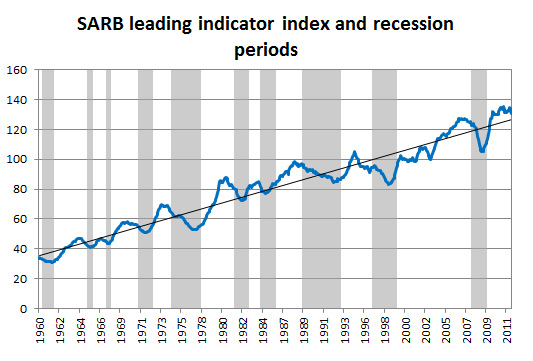
But how reliable is the leading indicator as a forbearer of recession? The grey shaded areas in the graphs show the recessions called by the Reserve Bank since 1960. The table shows the recessions called since 1946. However, the leading indicator time series is only available since 1960.
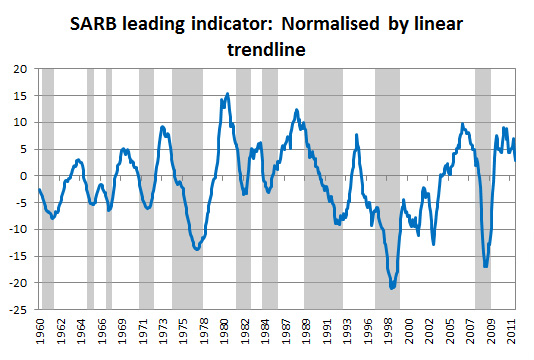
Looking at the leading indicator itself, very little can be ascertained by the up and down movements in the index. Even "normalising" the index, using its linear trendline, show numerous false signals and reversals if one looks at the turning points, while breaches of the zero line are mostly occurring well into the recessions.
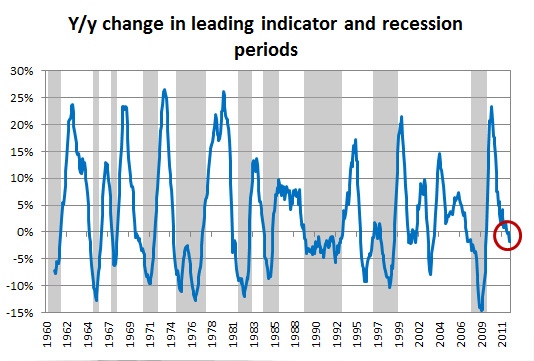
The year-on-year change in the leading indicator would appear to be the best indicator of a recession based on the breaching of the 0%-line. This measure shows that, on average, the leading indicator gave around 5,3 months advance warning of a recession. However, on two occasions (November 2000 and February 2003), the y/y change line turned negative without a recession being called by the SARB. Also, on three occasions in the past, the change in the leading indicator became negative only after the event (i.e., after the recession had already started).
| Recession period as called by the SA Reserve Bank | Duration of recession in months | Number of months "advance notice" of recession |
| August 1946 - April 1947 | 9 | NA |
| December 1948 - February 1950 | 15 | NA |
| January 1952 - March 1953 | 15 | NA |
| May 1955 - September 1956 | 17 | NA |
| February 1958 - March 1959 | 14 | NA |
| May 1960 - August 1961 | 16 | NA |
| May 1965 - December 1965 | 8 | 5 |
| June 1967 - December 1967 | 7 | -1 |
| January 1971 - August 1972 | 20 | 11 |
| September 1974 - December 1977 | 40 | 3 |
| September 1981 - March 1983/b> | 19 | 8 |
| July 1984 - March 1986 | 21 | -1 |
| March 1989 - May 1993 | 51 | 0 |
| December 1996 - August 1999 | 33 | 17 |
| December 2007 - August 2009 | 21 | 6 |
| Average | 20.4 | 5.3 |
Table 1: Recessions and the SARB Leading Indicator
Based on past history (since 1965), there is about an 80% chance that a breach of the 0%-line by the y/y change in the leading indicator will herald a recession. Since January 2012, the y/y change in the leading indicator has been in negative territory. Is it showing the imminent arrival of a recession or is it another false signal? We can only hope it is the latter!
Share this article on