Quantec logo
Quantec logo
  • Home
  • EasyData
  • Software
  • EIU
  • About
  • News
  • EasyData Log In
  • Contact

South African regional trade and industry data analysis

February 14, 2019

At Quantec we provide South African regional trade data, as part of our EasyData Trade Service. In this blog post, we will be focusing on our data set, RSA Regional Trade QSIC (TRD11).

The purpose of this post is to introduce TRD11, and to show how it could be used to visualise and analyse South African regional trade data. The visualisations in this post have been coded in Python—using the Pandas and Altair libraries. For those who are interested, the code will be made available on GitHub.

Take note, it is not the intention to draw any conclusions from the data in this post, but merely to show what is available.

The RSA Regional Trade QSIC data set

The TRD11 data set has been developed using source data collected from SARS (South African Revenue Service) and using our own QSIC classification (Quantec Standard Industrial Classification based on Stats SA's 5th revision) . Data is updated on a quarterly basis and is available on our EasyData web application, where you can select and filter each of TRD11's 7 dimensions—QSIC, Reporter, Region (trade partner), Port, Unit, Flow (Import/Export), and Date. As of today, 14 February 2019, data frequency is given as quarterly (2010Q1 until 2018Q4) and annually (1995 until 2018). 

Bear in mind that this data deals with the trade between South African regions (Reporter) and the rest of the world's countries (Region), and not the trade between the regions themselves.

Screenshot of TRD11 on EasyData

Figure 1: Screenshot of TRD11 on EasyData.

Regional view of South African Exports

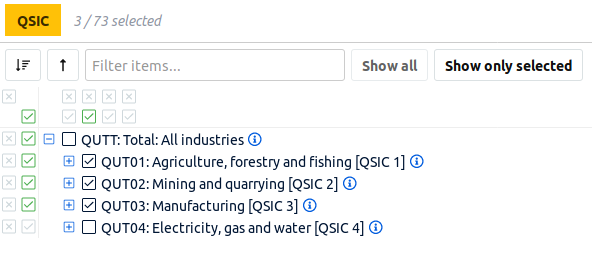
The QSIC dimension is broken up into a hierarchy (see Figure 2).

QSIC dimension hierarchy

Figure 2: QSIC dimension hierarchy

Let's take a birds eye view of the regional exports (down to municipal level) for the aggregated industries*: 

  • Agriculture, forestry and fishing [QSIC 1]
  • Mining and quarrying [QSIC 2]
  • Manufacturing [QSIC 3]

* I have purposefully left out "Electricity, gas and water [QSIC 4]" since it is concentrated in Gauteng only (Eskom).

Figure 3: RSA Regional export visualisation.

The above interactive visualisation (Figure 3, mouse over a region to see Rand value), shows the total exported values for the year 2018 by municipality as calculated by Quantec / SARS.

Western Cape Trade

Zooming in on the Western Cape municipalities (Figure 4), we see the split per Industry for exports in 2018.

Figure 4: Western Cape Regional export visualisation.

TRD11 can also provide data on a quarterly basis—let's have a look at the trends for each Industry for both Imports and Exports from the Western Cape (2010 to 2018).

Fig 3: Western Cape Trade and Industry

Figure 5: Western Cape imports and exports for each main industry on a quarterly basis (2010 to 2018).

The QSIC dimension can be futher expanded for each main industry. 

We see the import and export data for Agriculture followed by Fishing and Forestry (Figure 6).  Looking at the trade balance, it is clear the Western Cape is exporting more Agricultural & Fishing commodities than importing from abroad. The seasonality of agriculture commodities is also apparent.

Fig 4: Western Cape trade [Agriculture, Fishing, Forestry]

Figure 6: Western Cape Agriculture, Fishing and Forestry imports and exports on a quarterly basis (2010 to 2018).

Doing the same for "Mining and quarrying [QSIC 2]"—we can expand it further into:

  • Coal [QSIC 21]
  • Crude oil and natural gas [QSIC 22]
  • Gold [QSIC 23]
  • Iron ore [QSIC 241]
  • Copper [QSIC 2422]
  • Platinum group metals [QSIC 2424]
  • Other metallic minerals [QSIC 2429]
  • Building materials [QSIC 251]
  • Other non-metallic minerals [QSIC 253]

Western Cape's imports and exports in this industry it is dominated by Crude oil and natural gas (Figure 7).

Fig 5: Western Cape trade / Exports [Mining]

Figure 7: Western Cape Mining imports and exports on a quarterly basis (2010 to 2018).

By removing "Crude oil and natural gas" from our analysis, we can better see data on the remaining sub-industries (Figure 8).

Fig 6: Western Cape trade [Mining and quarrying without Crude oil and natural gas]

Figure 8: Western Cape trade [Mining and quarrying without Crude oil and natural gas]

Manufacturing [QSIC03] breaks down into 42 sub-industries at the highest level of detail. Showing the same graph for these sub-industries is a bit cluttered (see Figure 9).

Fig 7: Western Cape trade [Manufacturing]

Figure 9: Western Cape trade [Manufacturing 42 sub-industries]

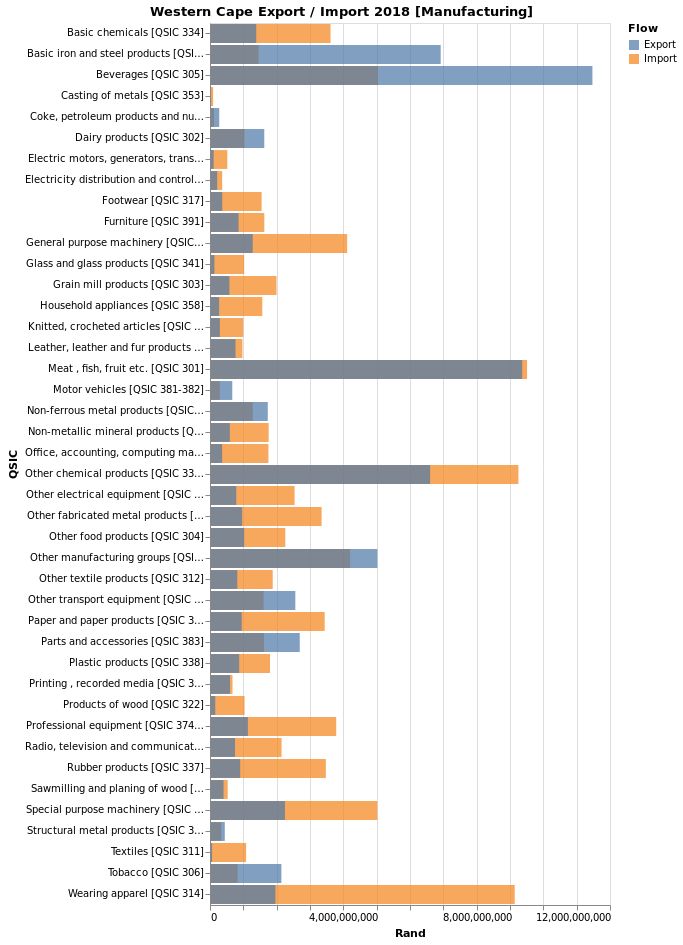
To get a better picture, we show the imports and exports for 2018 only (Figure 10). The export of "Beverages [QSIC 305]" and the import of "Wearing apparel [QSIC 314]" is worth a special note.

Western Cape manufacturing import and export 2018

Figure 10: Western Cape manufacturing import and export (2018)

Western Cape trading partners

Which countries are the main trading partners of the Western Cape and how do they differ when looking at the various industries?

Mapping the data for Agriculture, Forestry and Fishing we can identify Namibia as a major import partner, and European countries such as the Netherlands and the United Kingdom for exports. Hover over the visualisation (Figure 11) to see the Rand values for 2018 of the various countries.

Figure 11: Western Cape trading partners for Agriculture, Forestry and Fishing.

What if you are interested in finding out the specific products being imported from Namibia? Which products are being exported to the Netherlands from the Western Cape? Fortunately, EasyData provides access to the "RSA Regional Trade HST 6-digit" (TRD12) data set. I will deviate slightly here to quickly show the top 20 commodities in each case.

Starting in 1988, the HS has undergone several changes in the classification of products with revisions in 1996, 2002, 2007 and 2012. Following from this, the Combined Harmonised System (HST) is the World Bank’s World Integrated Trade Solution (WITS) internal nomenclature.

Analysing the results for 2018, Figure 12 shows the top 20 HST products imported from Namibia.

Western Cape top import products from Namibia in 2018 [HST 6-digit]

Figure 12: Western Cape top imported products from Namibia in 2018 [HST 6-digit]

Using the TRD11 data set, we can also check the top ports of entry for Namibia. Figure 13 shows Skilpadhek to be the most used port.

Fig 13: Western Cape top 5 ports of entry for imports from Namibia

Figure 13: Western Cape top 5 ports of entry for imports from Namibia

The top HST 6-digit products being exported to the Netherlands from Western Cape is shown in Figure 14 below. As expected, it is mainly fresh Agricultural and Fishing products.

Western Cape top export commodities to the Netherlands in 2018 [HST 6-digit]

Figure 14: Western Cape top export commodities to the Netherlands in 2018 [HST 6-digit]

Looking at the data for the Mining and Quarrying industries it shows our Crude oil and Gas trading partners, namely Saudi Arabia, Nigeria, Angola and Ghana. Exports in this sector flow mainly to our neighbouring countries: Namibia and Botswana.

Figure 15: Western Cape trading partners for Mining and Quarrying.

Unsurprisingly, Figure 16 confirms China as the top import partner for manufactured goods, with exports from Western Cape focused on Namibia (and neighbouring countries) and the USA.

Figure 16: Western Cape trading partners for Manufacturing.

EasyData Trade Service

If you think our trade data could be useful for your own analysis, get in touch. You can sign up for a free trial which is useful to get a feel for our EasyData system. In case your organisation is evaluating a subscription, we can provide a trial for access to the EasyData Trade Service.


Share this article on

  • Twitter
  • Facebook
  • LinkedIn
  • Email

Quantec News

All news articles

About Quantec

Quantec is a consultancy providing economic and financial data, country intelligence and quantitative analytical software.

Recent news

Stata Specialised Webinars in June, July and August - 15 May 2025

Construction Materials Suppliers - April 2025 - 06 May 2025

Stata 19 is here! - 10 Apr 2025

South African Gross Value Added - 13 Mar 2025

South Africa Foreign Merchandise Trade — March 2025 Report - 06 Mar 2025

South Africa Financial Conditions Index — February 2025 Report - 11 Feb 2025

© 2025 Quantec | Terms & Conditions
Site by OffCanvas